The Rise of Foodpreneurs
It’s likely been a problem from the dawn of human history: what’s for dinner? Of course, most of us no long have to hunt down animals to have a meal. However, many Americans like to eat out or order in, leaving a lot of opportunity for “food discovery” web and mobile apps, which we’ll discuss shortly. First, some stats on dining out/ take out habits in the United States.
Food Entpreneuring: By the Numbers
Our Fast Food Habits
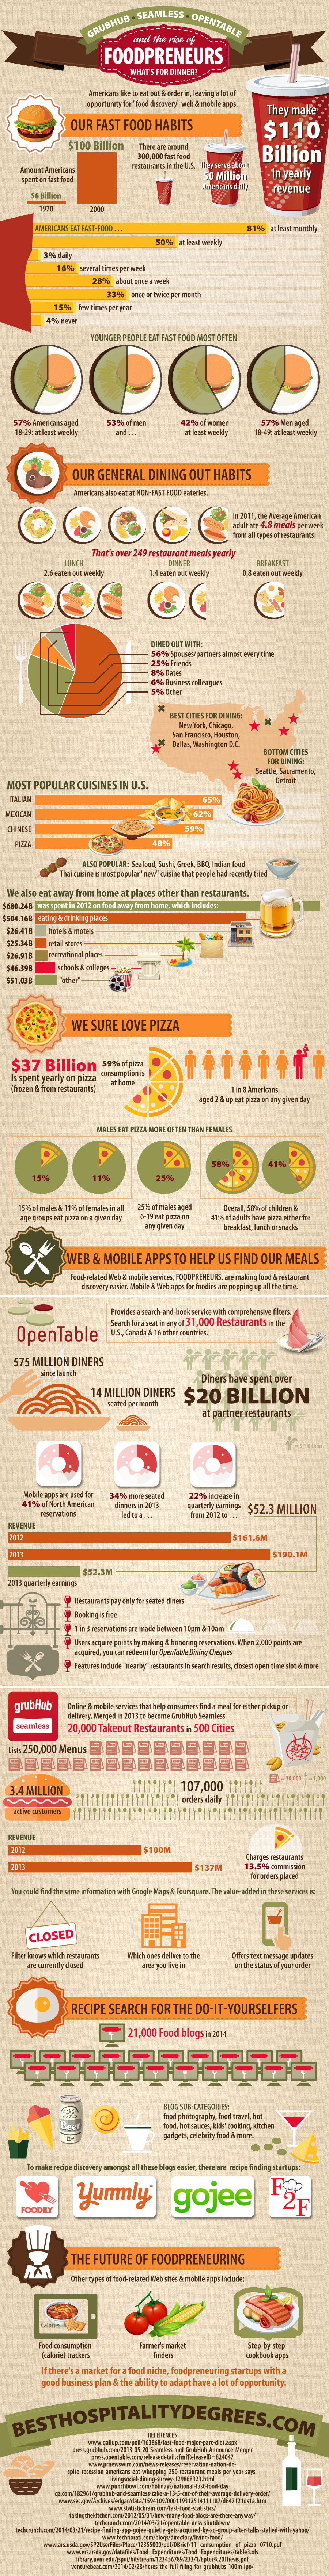
According to Statistic Brain (quoting Pew Research Center), there are around 160K fast food restaurants alone in the United States, which serve about 50M Americans daily, pulling in at least $110B in yearly revenue (as of about 2002). Note: the Pew report was published in 2006.
Punchbowl.com more recently puts the number of American fast food restaurants at nearly double Pew’s : over 300K places. They indicate that Americans spent only $6B on fast food in 1970 — a small percentage (5.45%) of the $100B spent in 2000.
According to a Jul 2013 Gallup poll of 2,027 Americans:
- About 8 of 10 (81%) Americans eat at a fast-food restaurant at least monthly. Nearly half eat fast food at least weekly. The numbers break down as follows:
- 3% eat fast food daily
- 16% eat it several times per week
- 28% eat it about once a week
- 33% eat it once or twice per month
- 15% eat it a few times per year
- 4% say they never eat fast food.
- Younger people eat fast food most often. 57% of young adults 18-29 years eat it at least weekly (including daily and several times per week).
- 53% of men and 42% of women surveyed eat fast food at least weekly, with 57% men in the 18-49 age group eating it at least weekly.
Our General Dining Out Habits
Of course, Americans also eat at non-fast food eateries. Some dining facts according to LivingSocial’s “Dining Out” survey — conducted online by Mandala Research — in Aug 2011 with about 4,000 American adults:
- As of 2011, the average American adult ate nearly 5 (4.8) meals per week from all types of restaurants (whether sit-down or carryout).
- That’s equivalent to over 249 restaurant meals yearly, on average.
- Lunch is most commonly the “eat out” meal, with survey respondents averaging about 2.6 lunch meals eaten out weekly — including sit-down and carryout.
- For dinner, it’s 1.4 sit-down meals weekly at restaurants.
- For brunch/ breakfast, it’s 0.8 meals per week.
- 56% said they “dined out with their spouses or partners almost every time or every time.”
- 25% of the time, friends were dining partners, compared to 8% dates and 6% business colleagues.
- The best cities for dining: New York, Chicago, San Francisco, Houston, Dallas and Washington, D.C., were the top six, in decreasing rank.
- The bottom three in the list were Seattle, Sacramento and Detroit.
- Survey respondents ranked four cuisines reigned supreme over the 22 other types mentioned: Italian (65%), Mexican (62%), Chinese (59%) and Pizza (48%). This in terms how many people say they eat a particular cuisine frequently.
- Below this four, the next highest ranked cuisines included seafood, Sushi, Greek, BBQ and Indian food.
- Thai cuisine ranked as the most popular “new” cuisine that people had recently tried.
We also eat away from home at places other than restaurants. According to a spreadsheet published by the ERS (Economic Research Service) of the USDA (U.S. Dept of Agriculture), a total of about $680.24B was spent in 2012 on food away from home, which includes:
- $504.16B at eating and drinking places
- $26.41B at hotels and motels
- $25.34B at retail stores, direct selling
- $26.91B at recreational places
- $46.39B at schools and colleges
- $51.03B at “other”
We Sure Love Pizza
Speaking of pizza, it is particularly popular in the U.S., according to the USDA, in a report covering consumption from 2007-2010.
- Americans spend ~$37B is spent yearly on pizza. This includes frozen/ chilled pizzas you can buy at the supermarket, as well as pizza consumed at or from restaurants.
- 59% of pizza consumption is at home, though that average breaks down to 65% adults and 49% children.
- The obsession is such that about 1 in 8 (13%) Americans aged 2 or older eat pizza on any given day. The range is: 22% for children (6-11 years) and adolescents (12-19), down to 6% in adults 60+.
- For most age groups, male eat pizza more often than females. Collectively, 15% of males and 11% of females in all age groups eat pizza on a given day.
- Over 25% of males aged 6-19 eat pizza on a given day.
- While most adult Americans eat most of their pizza for dinner, children tend to eat it almost equally at lunch (44%) and dinner (42%).
- Some people even eat pizza for breakfast: 4% of children (2-19) and 2% of adults (20+).
- Snack pizza is eaten by 10% of children and 11% of adults.
- Overall, 58% of children have pizza either for breakfast, lunch or snacks. For adults, that number is 41% for adults.
Where and When Did Our Eating Habits Stray?
In a 2009 graduate thesis for the University of Vermont, Anthony Epter points out a few facts about the food industry in the USA:
- In 1939, 19.2% of food expenditures were made away from home.
- Of these away sales, 7.1% were from “limited-service or fast-food style restaurants.”
- $3.6B was spent on food sales away from home, $15.1B on foods consumed at home.
- As of 2003, 13% of the U.S. GNP (Gross National Product) was from the food industry.
- In 1900, 40% of Americans lived on a farm. Since then, according to one study, the percentage of women in the workforce rose from 21% in 1900 to 60% by 1998.
- Families used to spend about 44 hours per week in 1900 doing “food related work,” and only 10 hours per week by 1998.
- While more men cook these days, these stats suggest that the burden of feeding a family still falls mostly to women, despite changing social mores. Presumably, “time-saving” kitchen gadgets have reduced some of the time spent prepping meals.
- The food industry has also spent a considerable amount of money advertising: about $10B yearly (as of 2009). (Only the auto industry spends more on ads.)
- An estimated 18% of all ads are food-related.
- $3.5B was spent on fast food-related TV ads in 2002.
- $5.8B covers food, beverage and confectionery TV ads.
Web and Mobile Apps to Help Us Find Our Meals
Convenience is the name of the game here, and a number of food-related Web and mobile services — foodpreneurs, if you will — are making food / restaurant discovery easier.
In fact, Mobile and Web apps for foodies are popping up all the time, and several have received VC funding — albeit not necessarily at the same funding levels as other online, non-food tech startups. Some foodpreneur startups have filed for IPO recently or have been in IPO for several years, which shows a maturing of the niche.
This is by no means an exhaustive list of food-related Web and mobile apps, although here are a few that have been prominent lately, as well as some of their competitors.
OpenTable: Save Me a Seat
Entertaining guests and looking for a suitable restaurant? While hardly a startup anymore, having been established in 1998, OpenTable provides a search-and-book service with comprehensive filters.
- Search for a seat in any of 31,000 restaurants in the USA, Canada and 16 other countries.
- They claim 575M diners since launch.
- 14M diners are seated per month through OpenTable.
- Diners have spent over $20B at partner restaurants
- Mobile apps (available since 2008) are used for over 40% (41%) of North American reservations.
- OpenTable filed for an IPO in 2009 and went public on May 21st of that year.
- OpenTable announced Q4 2013 quarterly earnings of $52.3M in Jan 2014 — an increase of 22% over Q4 2012. (Results are for global operations.)
- This increase is due to 34% more seated dinners in 4Q13 than 4Q12.
- Total 2013 revenue was $190.1M — an increase of 18% over 2012 revenue of $161.6M.
- Restaurants pay only for seated diners.
- Booking is free and the no-show rate for reservations via OpenTable is only 5%.
- Almost 1/3 of reservations are made at night, between 10pm and 10am.
- User acquire points by making and honoring reservations.
- 100 points are acquired per standard reservation made and kept. There are also “1,000-point” reservations at some restaurants, which earn, of course, 1,000 points.
- When 2,000 points are acquired, you can redeem the for OpenTable Dining Cheques in the U.S., Canada and the UK.
- Features include “nearby” restaurants in search results, a variety of filters, closest open time slot and more.
OpenTable has been around long enough that they’ve gone into acquisition mode:
- Toptable.co.uk is a similar service in the UK that is offered by OpenTable.
- OpenTable announced in Feb 2014 the purchase of the restaurant recommendation app Ness for $17.3M all-cash. (Ness’s investors, on the other hand, had raised $20M.)
- The Ness app will cease but it’s technology will be part of various OpenTable apps.
- Previously, they purchased Quickcue (Dec 2013, $11.5M), JustChalo (Jun 2013, $11M) and Foodspotting (Jan 2013, $10M). All of these sites were involved in the food services industry in some way.
- Foodspotting goes beyond the “restaurant discovery” model and lets you search by a type of food or even a person. For example, if you type “bobby flay” (a celebrity chef), you’ll get results back relevant to him, including tweets about food mentioning him, restaurants owned by him, and other mentions.
GrubHub, Seamless: Takeout Made Easy
GrubHub and Seamless, two “food delivery” startups, are now part of the same company, GrubHub (sometimes referred to as “GrubHub Seamless”), but operate under separate brands. They are online / mobile services that help consumers find a meal for either pickup or delivery. While they’re described as “food delivery” startups, neither service does any delivery, acting more like an online interactive telephone book with extra features.
- GrubHub and Seamless announced their merger in May 2013, to become known as GrubHub Seamless, aka GrubHub Inc.
- Combined, they estimated serving 500 cities in the U.S. and over 20K takeout restaurants.
- As a parent company of Allmenus and MenuPages, GrubHub lists about 250K menus.
- Their combined 2012 online and mobile platforms generated $875M gross sales, for a revenue of over $100M.
- For 2013, their combined gross food sales was about $1.3B, with $137M in revenue.
- They currently serve about 3.4M active customers and handle ~107K orders daily.
- The original GrubHub has had about $84M in VC funding, and Seamless about $51M, for a total of about $135M.
- GrubHub Inc. announced in Feb 2014 their IPO to raise $100M, which they amended in Mar 2014 to about $177.86M, on a possible valuation of over $1.72B.
- The company is offering 4M shares, with additional stockholders offering just over 3M (3.03M) more shares.
- Rumors are that GrubHub has been planning to go IPO since 2009 — several years before merging with Seamless.
- Consumers can pay with cash, credit card or PayPal(tm).
- GrubHub and Seamless charge restaurants about 13.5% commission — as estimated by qz.com using GrubHub Seamless’s IPO prospectus — for food orders placed on their Web sites and mobile apps.
- Other accounts say the commissions are between 5-15%, depending on which extras restaurants select.
- Restaurants can optionally pay extra to rank higher in search results on GrubHub and Seamless — something that is transparent to hungry consumers using the services.
Convenience is the key with these services. Theoretically, a hungry consumer can find the same information with Google Maps and Foursquare. The value-added in these services is as follows:
- Grubhub and Seamless have a filter that knows which restaurants are currently closed (e.g., don’t open until 5pm, etc) and which ones deliver to the area you live in.
- They will also tell you how many such filtered restaurants you can order from.
- Grubhub offers text message updates on the status of your order.
Areas of possible improvement include better filters. Though since restaurants sometimes pay to rank higher in GrubHub and Seamless search results (whether consumers know this or not), they may not be happy with better filters that could potentially make them less visible. Too many choices, though, and “paralysis of choice” might kick in with consumers who may, out of convenience, just go with a restaurant they’re familiar with (e.g., one with a magnet on their fridge).
This leaves an opportunity for foodpreneurs who come up with a better restaurant discovery model that’s sustainable as well as fair for both hungry consumers and restaurants operating on thin margins.
ChowNow.com takes a different approach. Restaurants can integrate an ordering platform (from chownow) into their own Web site or Facebook page. This more transparent approach keeps the Web traffic with the restaurant’s site and builds up their brand instead of giving away their traffic to a third party. However, this does not solve the “discovery” problems of “what’s near by of this cuisine” or “who delivers to my area”.
Recipe Search for the Do-It-Yourselfers
Of course, most Americans would rather have a home cooked meal, judging by the fact that there are two separate TV channels in the USA that cover food (Food Network, Cooking Channel), not to mention countless cooking shows on other channels. As well, food blogs with recipes are popular, and many traditional media organizations (newspapers, TV channels, magazines, etc.) also share recipes online.
- It’s hard to exact, up-to-date numbers on food blogs. As of late Mar 2014, Technorati listed over 21K (21,101) blogs tagged in their directory in the “food” category. However, these figures change frequently and many become inactive.
- Amongst all of these food blogs are sub-categories such as food photography, food travel, hot food, hot sauces, kids’ cooking blogs, kitchen gadget blogs, celebrity food blogs and more.
- There are also a growing number of “food blog” awards, pointing to the fact that food blogs are part of the foodpreneuring ecosystem.
To make recipe discovery amongst all these blogs easier, there are a handful of recipe finding startups, which include aggregation, bookmarking and search engine: Foodily.com, Food2Fork.com, Yummly.com, Gojee, Punchfork and others. While none of these cover anywhere close to all active food blogs, and some are hand-curated, most of these startups offer both Web and mobile apps for searching.
Most of these recipe search engines have mobile apps, and all of them rely on content from the aforementioned recipe sites. So far, the basic revenue model for these startups is freemium access for other developers to use their search engine in custom apps, paying only for programmatic access beyond a certain number of searches daily or monthly.
Punchfork (punchfork.com) is another such engine, and they once had a $995-month tier for custom use of their recipe search features. Their technology also once powered the notes app (Web, mobile) Evernote’s (evernote.com) Food app. However, Punchfork shutdown after being acquired by the social sharing Web site/ mobile app Pinterest in Jan 2013. Speculation is that Pinterest acquired Punchfork for the technology.
Gojee.com, a hand-curated recipe-aggregation site with award-winning apps, was acquired in Mar 2014 by XO Group, which publishes sites that include The Knot, The Bump, Wedding Channel. Financial details were not available at time of writing, although Gojee had previously raised $4M in VC funding.
The Future of Foodpreneuring
Some other types of food-related Web sites and mobile apps that were not mentioned here include food consumption (calorie) trackers, farmer’s market finders, and mobile step-by-step cookbook apps. As well, some recipe finders offer extra information such as calorie counts by meal, or possible allergens.
There are far too many areas of opportunity related to food discovery to list here. Suffice it to say that if there’s a market for a food niche, foodpreneuring startups with a good business plan and the ability to adapt have a lot of opportunity. There are also now enough “big fish” out there who may just pay to snap up a valuable foodpreneuring business.
References
Information for this article was collected from the following pages and web sites:
- http://www.gallup.com/poll/163868/fast-food-major-part-diet.aspx
- http://press.opentable.com/releasedetail.cfm?ReleaseID=824047
- http://www.prnewswire.com/news-releases/reservation-nation-despite-recession-americans-eat-whopping-250-restaurant-meals-per-year-says-livingsocial-dining-survey-129868323.html
- http://www.punchbowl.com/holidays/national-fast-food-day
- http://qz.com/182961/grubhub-and-seamless-take-a-13-5-cut-of-their-average-delivery-order/
- http://www.statisticbrain.com/fast-food-statistics/
- http://takingthekitchen.com/2012/05/31/how-many-food-blogs-are-there-anyway/
- http://techcrunch.com/2014/03/21/opentable-ness-shutdown/
- http://techcrunch.com/2014/03/21/recipe-finding-app-gojee-quietly-gets-acquired-by-xo-group-after-talks-stalled-with-yahoo/
- http://www.ars.usda.gov/SP2UserFiles/Place/12355000/pdf/DBrief/11_consumption_of_pizza_0710.pdf
- http://www.ers.usda.gov/datafiles/Food_Expenditures/Food_Expenditures/table3.xls
- https://library.uvm.edu/jspui/bitstream/123456789/233/1/Epter%20Thesis.pdf
- http://venturebeat.com/2014/02/28/heres-the-full-filing-for-grubhubs-100m-ipo/